Say you just finished optimizing your React app and making every button click as fast as possible. Now, you want to keep an eye on the app’s performance – set up measurements around interactions and learn if the app gets slower again.
Here’s how to do that.
No Ready-To-Go Solutions
Tracking React render performance is challenging. With loading performance, there’s a whole lot of tools you could just plug in and start collecting data. There’s nothing like that for render performance.
To track how your app behaves after it loads, you’d need to do some work.
Disclaimer: the solution below is not battle-tested. These steps are based on the experiences of clients I worked with, plus my experiments in the field. It’s how I would approach setting up performance tests today. However, I haven’t had a chance to implement this in a real-world app myself yet.
This means I might not be aware of some edge cases or pitfalls. This guide should be a good starting point for setting up your monitoring system, but it might (or might not!) need fine-tuning to be useful.
(Have your experience to add? Please share it on Twitter!)
Step 1: Pick the Most Important Interactions
Before you start monitoring render performance, you need to decide what to monitor.
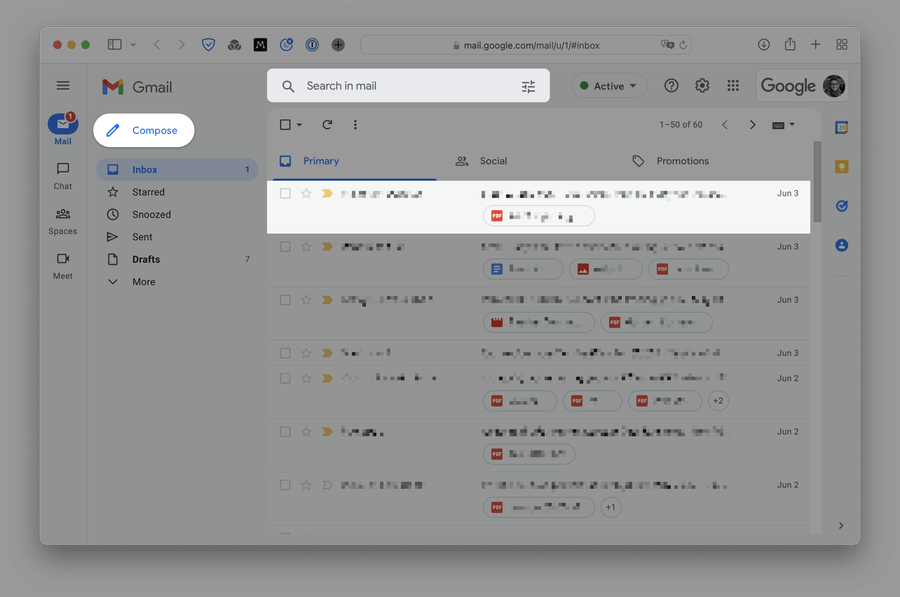
For that, pick the interactions you care about the most. For example, for an app like Gmail, that could be:
- Clicking the “Compose” button
- Opening an email thread
- Typing in the search field
Step 2: Instrument Every Interaction
For every interaction, find the moment when it starts – and wrap it with code that would measure its duration.
Here’s how this might look with Gmail’s Compose button:
import afterFrame from 'afterframe';

function measureInteraction() {
  // performance.now() returns the number of ms
  // elapsed since the page was opened
  const startTimestamp = performance.now();

  return {
    end() {
      const endTimestamp = performance.now();
      console.log('The interaction took', endTimestamp - startTimestamp, 'ms');
    },
  };
}

const ComposeButton = () => {
  const handleClick = () => {
    const interaction = measureInteraction();

    // The afterFrame library calls the function
    // when the next frame starts
    afterFrame(() => {
      interaction.end();
    });

    openComposePane();
  };

  return <Button onClick={handleClick}>Compose</Button>;
};
Sidenote: afterFrame docs
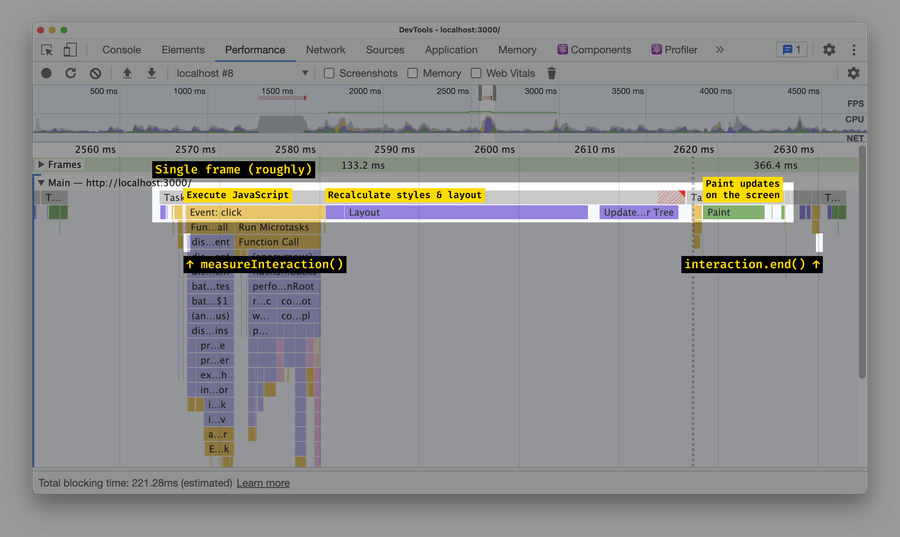
This code will execute measureInteraction(), then open the compose pane, then paint the update on the screen, and then call interaction.end():
Why use afterFrame?
afterFrame was specifically designed to take a function and run it right after the current frame ends. With afterFrame, we end up measuring the whole duration of the interaction – including the time it takes for the browser to prepare and apply updates on the screen.
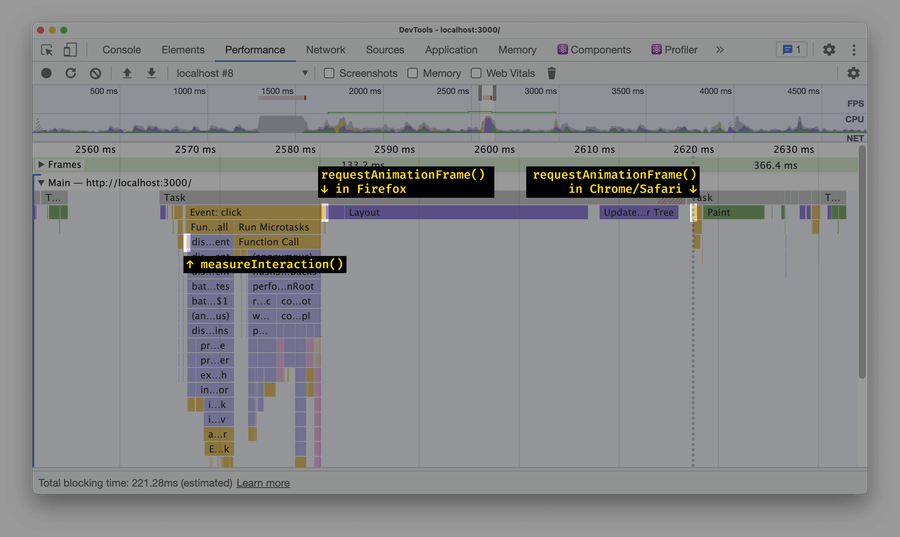
Compare this with e.g. requestAnimationFrame. A callback you pass into requestAnimationFrame executes either before “Recalculate styles & layout” or before “Paint”, depending on the browser. As a result, the measurement omits one or several parts of the browser’s processing:
setTimeout(..., 0), Promise.resolve().then() and other straightforward solutions also struggle from similar issues. See “Accurately measuring layout on the web” by Nolan Lawson for more.
Why not useEffect?
Most of the time, a function you’d pass into useEffect would be called at the beginning of the next frame – just like afterFrame.
However, with React 18, if the app updates in response to user input, useEffect fires synchronously. And even with React 17 and below, a useEffect will also run early if you have scheduled several renders in a row.
Why not React Profiler API?
React Profiler is a built-in React component that measures how long its children take to render. If you used it for Gmail’s Compose button, it would look like this:
import { Profiler } from 'react';

const ComposeButton = () => {
  const handleRender = (id, phase, actualDuration) => {
    console.log(
      `The ${id} interaction took ` +
        `${actualDuration}ms to render (${phase})`,
    );
    // Would log “The ComposeButton interaction
    // took 25.2999999970197678ms to render (update)”
  };

  return (
    <Profiler id="ComposeButton" onRender={handleRender}>
      <Button onClick={handleClick}>Compose</Button>
    </Profiler>
  );
};
The challenge is that React Profiler measures only a part of the whole interaction:
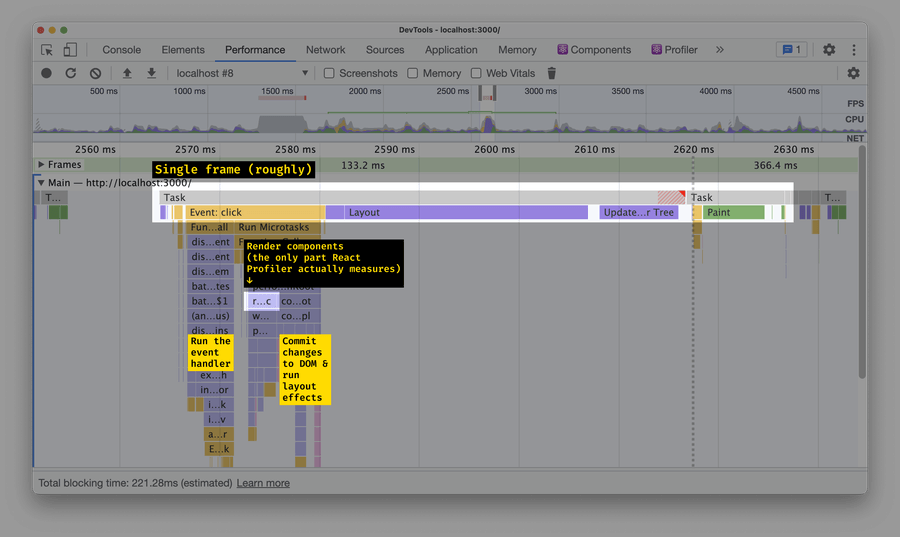
renderRootSync – this is where React renders all components.If you added an expensive useLayoutEffect or accidentally increased your layout costs twice, React Profiler just wouldn’t catch that.
What about performance.mark()/performance.measure()?
Instead of using performance.now() to measure how long an interaction took, you could also use performance.mark() and performance.measure() APIs:
function measureInteraction(interactionName) {
  performance.mark(interactionName + ' start');

  return {
    end() {
      performance.mark(interactionName + ' end');
      const measure = performance.measure(
        interactionName + ' duration',
        interactionName + ' start',
        interactionName + ' end',
      );
      console.log('The interaction took', measure.duration, 'ms');
    },
  };
}
It’s slightly more complex, but has two useful side effects:
-
performance.measure()entries are visible in Chrome DevTools, which makes debugging performance issues easier: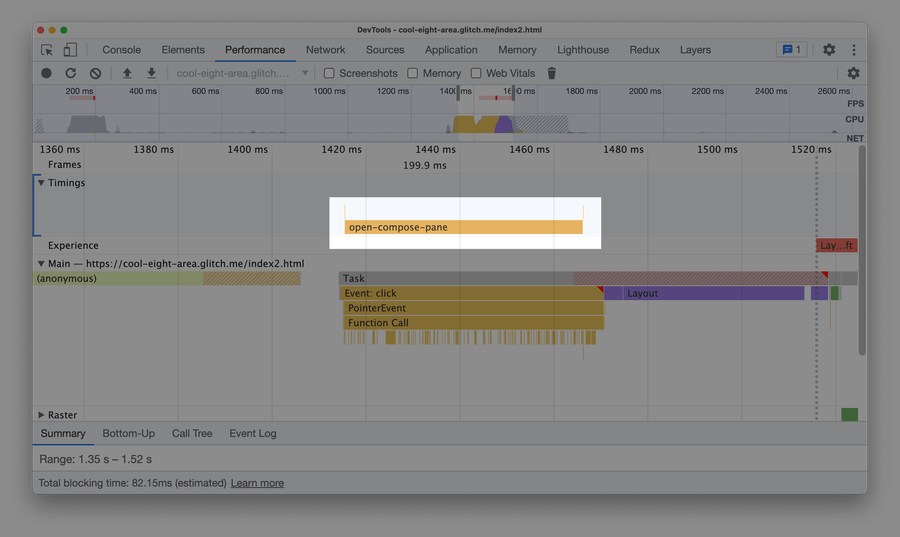
-
Another part of the app can read all
performance.mark()andperformance.measure()entries (usingPerformanceObserverwith typesmarkandmeasure). This is helpful when you have an independent monitoring script that needs to collect measurements from the whole app.
How does this work with React 18’s concurrent rendering?
This, unfortunately, doesn’t. If the interaction you’re trying to measure uses useTransition or useDeferredValue:
const ComposeButton = () => {
  const [isTransitioning, startTransition] = useTransition();

  const handleClick = () => {
    const interaction = measureInteraction();

    afterFrame(() => {
      interaction.end();
    });

    startTransition(() => {
      openComposePane();
    });
  };

  return <Button onClick={handleClick}>Compose</Button>;
};
afterFrame will fire too early:
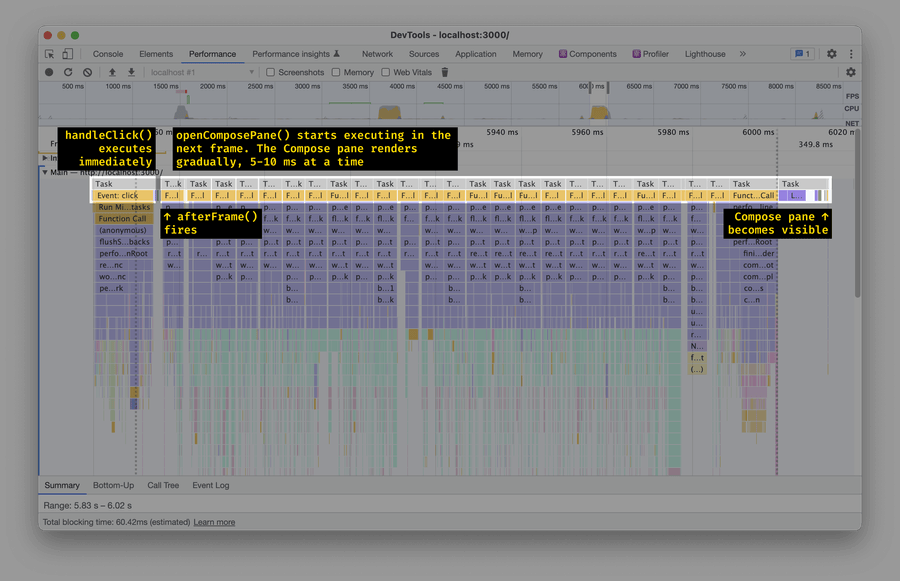
With concurrent rendering, you’d probably need to use useEffect instead, even though it’s imprecise.
Step 3: Collect Measured Durations
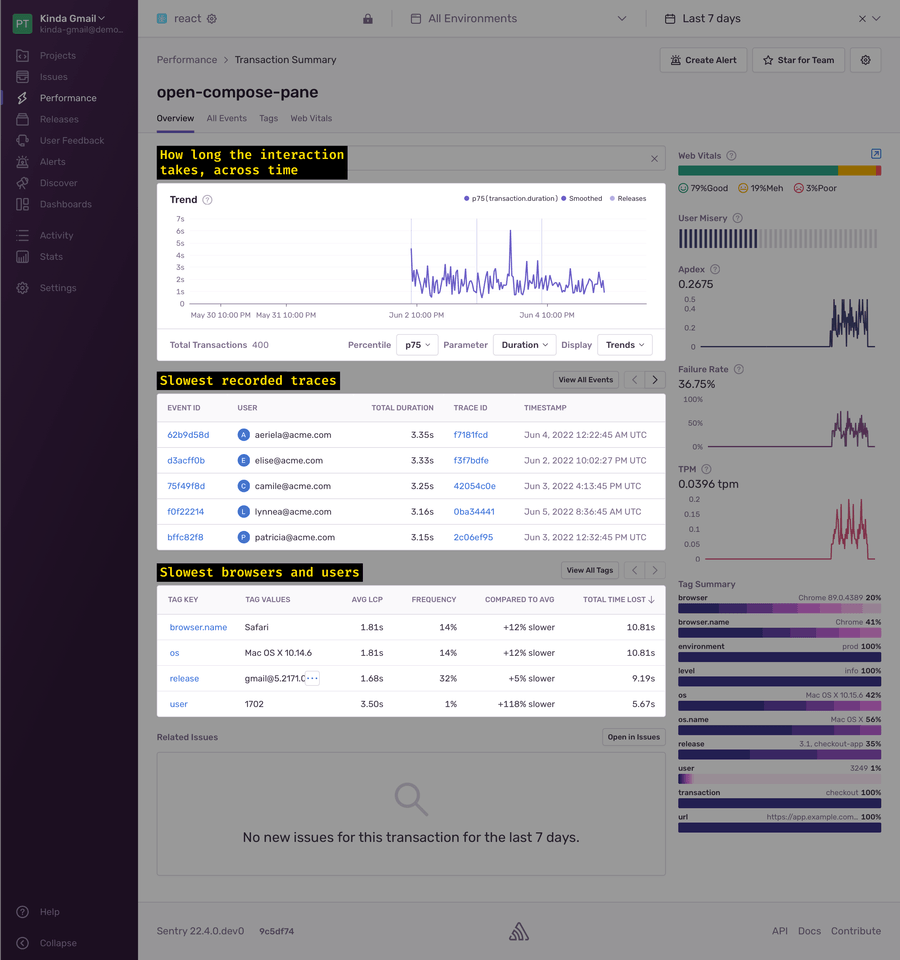
With interaction measurements in place, it’s time to collect and send them somewhere. My favorite tool for this is Sentry.
Sidenote: Other teams I’ve worked with also used DataDog, New Relic, and custom solutions built upon Google BigQuery or AWS DynamoDB
To collect performance data into Sentry, update measureInteraction() to use Sentry.startTransaction and transaction.finish():
function measureInteraction(interactionName) {
  const transaction = Sentry.startTransaction({ name: interactionName });

  return {
    end() {
      transaction.finish();
    },
  };
}
Sentry will collect the transactions you submit – and show you how they change over time, what’s common between the slowest transactions, and more:
Step 4: Collect Additional Data
In addition to tracking the most important interactions, consider collecting data about all long tasks and events. This is useful to see larger trends: if the number of long frames grows over time, the app is getting slower.
To collect long tasks or events, use the PerformanceObserver API:
// Include the performance events to track:
// - longtask: triggered when any piece of JavaScript took more than 50 ms to execute
// - event: triggered when any event happens
// Other events: http://developer.mozilla.org/en-US/docs/Web/API/PerformanceEntry/entryType
const performanceEventsToTrack = ['event', 'longtask'];

const observer = new PerformanceObserver((list) => {
  // This callback is called whenever a new event
  // (or a series of events) occurs
  for (const entry of list.getEntries()) {
    // Skip `event` events that were cheap
    if (entry.entryType === 'event' && entry.duration < 50) continue;

    // Send the event to a data warehouse
    // (see below for a Sentry example)
    sendEntryToDataWarehouse(entry);
  }
});

observer.observe({ entryTypes: performanceEventsToTrack });
In Chrome 102, event and longtask entries look like this:
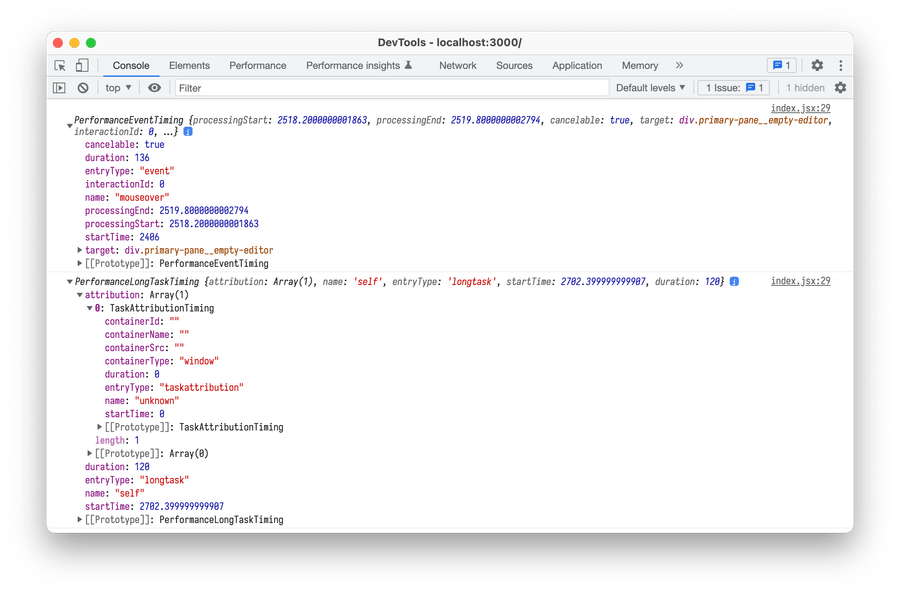
interactionId was shipped just a few months ago.In the above code, there’s a sendEntryToDataWarehouse function that sends events to the server. Here’s how it might look with Sentry:
function sendEntryToDataWarehouse(entry) {
  if (entry.entryType === 'event') {
    Sentry.captureMessage('Long event handler', {
      level: 'info',
      contexts: {
        details: {
          duration: entry.duration,
          startTime: entry.startTime,
          eventKind: entry.name, // "click" or "keypress" or etc
          target: entry.target.className,
          // ...
        },
      },
    });
  } else {
    Sentry.captureMessage('Long task', {
      level: 'info',
      contexts: {
        details: {
          duration: entry.duration,
          startTime: entry.startTime,
          // ...
        },
      },
    });
  }
}
Step 5: Keep An Eye On The Metrics
Now you’re all set! Make sure to monitor these metrics regularly and – if they get worse – figure out why.
To keep the metrics on top of your mind:
- set up alerts to get notified when the metrics get worse
- or check the metrics on weekly/bi-weekly team sync-ups
Synthetic Testing
With the steps above, you’ll start collecting metrics from real users. (This is known as “RUM”, or “Real User Monitoring”.) RUM catches performance regressions right after they happen.
Sometimes, it’s useful to catch regressions before they happen. For example:
-
You refactor the codebase and want to check how that affected the performance. You run
npm run test-perf, and the command tells you whether the refactoring made the codebase faster or slower -
You want to ensure your team remembers to keep the app fast. You set up a CI check, and the CI immediately tells everyone if their PR breaches performance budgets
In this case, you’ll need to do synthetic testing instead. Synthetic testing means “running performance tests in a virtual machine, on demand”. Here’s how to set it up:
-
Pick the most important interactions. Just like in step 1 above.
-
Set up measurements. If you followed step 2 above to instrument interactions, you’re all good! Use that.
Otherwise, try running Lighthouse in the Timespan mode. The Timespan mode is like the regular Lighthouse – except that it measures the performance of interactions, not the loading speed.
For example, here’s how to measure how fast the Gmail’s “Compose” button is. Open Gmail → start a timespan recording → click the “Compose” button → stop the recording → read the Interaction to Next Paint value:
Sidenote: Why use Interaction to Next Paint? Because it’s specifically designed for what we’re trying to achieve: to measure how quickly an interaction takes. Docs
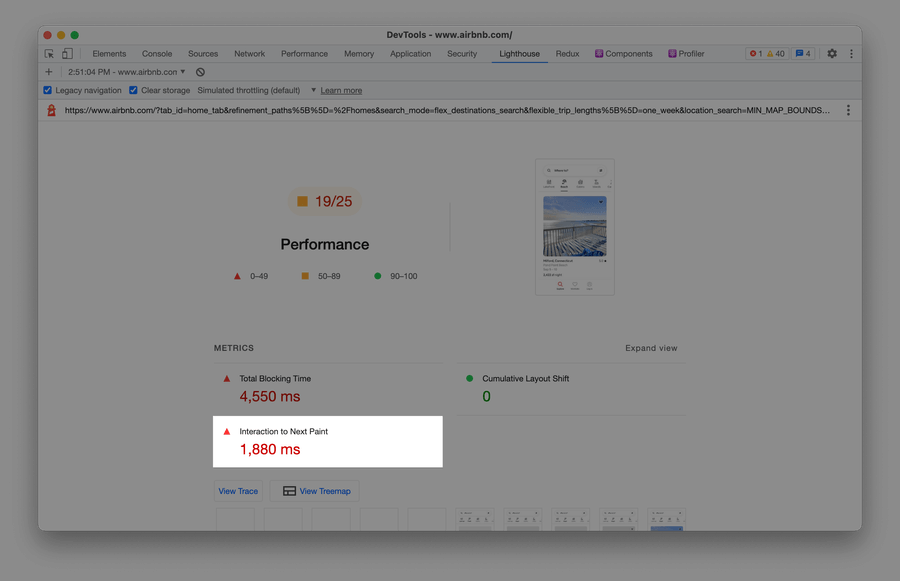
This is a human-readable Lighthouse report. In case you need to extract Interaction to Next Paint automatically, Lighthouse also returns data in the JSON format. See “Using Lighthouse Programmatically” for details. -
Set up a virtual machine that would run tests on demand. This might be a simple EC2 instance in AWS or a physical machine.
- Stable configuration. Make sure that the machine configuration stays the same over time! If it’s faster today and slower tomorrow, the tests would also return better values today and worse values tomorrow
- One test at a time. And make sure the machine never runs several tests in parallel. If you run two tests in parallel, each would steal a part of CPU capacity from the other – and report worse numbers
-
Run tests and collect measurements. Every time you need to run a synthetic test, run it on that machine and collect the measurements. Use a tool like Playwright or Puppeteer to launch the app in a headless browser and click it around like a user would do.
-
If you instrumented interactions manually: store measurements in a global variable (like
window.myPerfMeasurements) and then read them withpage.evaluate()Sidenote:
page.evaluate(): Playwright docs · Puppeteer docs - If you use Lighthouse’s Timespan mode: Playwright and Puppeteer work well with Lighthouse. Code example
-
-
Compare with the last 4-40 runs. Do not compare the measurements to the previous run. Instead, compare measurements with an average of the last 4-40 runs. (See “Fixing Performance Regressions Before they Happen” in Netflix Tech Blog for why this matters.)
Disclaimer: my previous experiments with synthetic testing failed: there’s been too much noise to catch any regressions. But that was before I learned how Netflix dealt with the same issue.
Others’ Experiences
Here are some of my clients’ experiences with render performance monitoring:
-
Client F. tracks both significant interactions and long tasks in their warehouse. They do not use
afterFrame– instead, every interaction uses an individual tracking approach. They’ve been tracking metrics like this for several years, and it’s been a success: metrics clearly show when something gets slower. -
Client Y. tracks long tasks and collects them into Sentry. What helped them to make sense of the data was adding a bunch of custom Sentry breadcrumbs around the app. Now, every long task has a history like “A user clicked button A”→ “2 seconds later, they clicked button B” → “10 ms later, the long task happened”.
Not every experience was positive, though:
- Client A. tried to set up interaction tracking but later disabled it. Their feedback was that it was hard to make sense of the data: “these numbers don’t make any sense with variables like user system resources, app and data size”.
Have your experience to add? Please share it in replies:
(Have you tried something like this in the past? Has it worked? Have you stumbled upon any pitfalls? Please share your experience ⬇️)
— Ivan Akulov 🇺🇦 (@iamakulov) June 6, 2022
